
"The ripple effect of tariff policies on employment can be calculated"... The power of Input-Output Tables
Shin Dong-su, head of the Input-Output Team at the Bank of Korea, explained the concept of Input-Output tables and their potential for economic analysis in a lecture video. He highlighted how these tables serve as an "economic map" to calculate the impact of external factors, such as tariff policies, on various industrial sectors and employment.
Can we calculate in numerical terms how the tariff policies of the Trump administration in the United States will affect South Korea's exports, and how much the number of employed persons in each industrial sector will decrease as a result? For those attempting to predict economic ripple effects, the Input-Output table serves as an "economic map" that is more than just simple statistics.
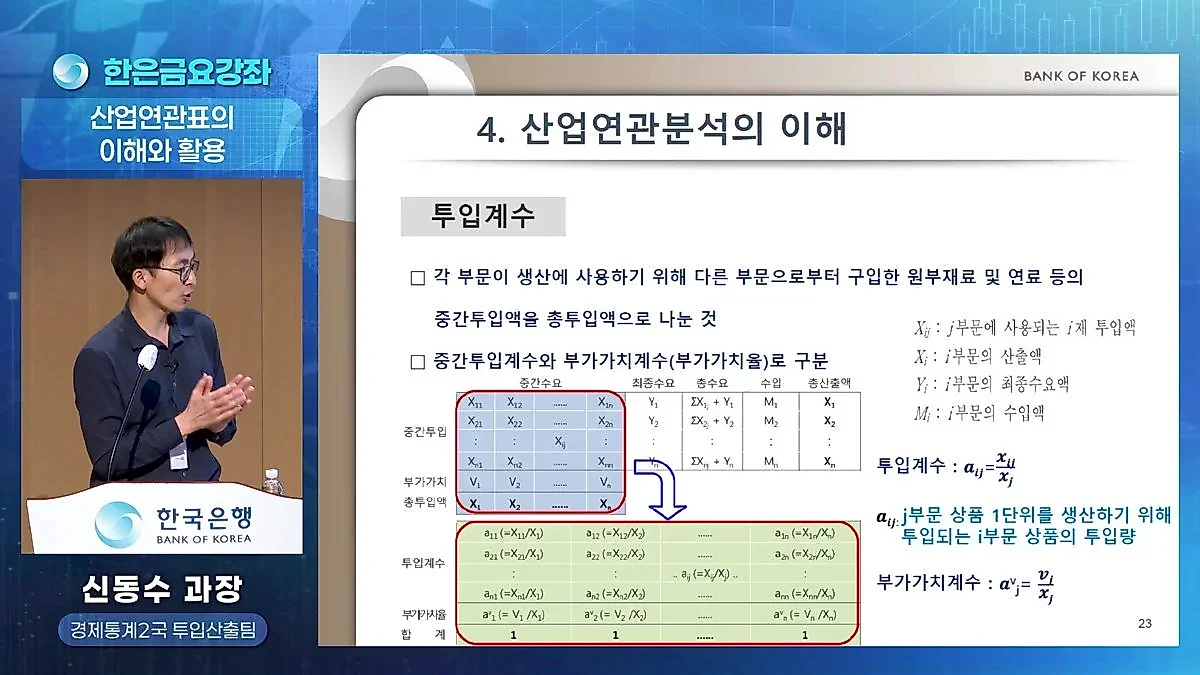
In a "Bank of Korea Friday Lecture" video released by the Bank of Korea, Shin Dong-su, a manager in the Input-Output Team, explained the concept of Input-Output tables and the possibilities of economic analysis using them. Shin defined the Input-Output table as "a comprehensive statistical table in matrix form that represents the transactions between industries, as well as the transactions between industries and the final demand sector, that occur during the process of producing and disposing of goods and services in the domestic national economy over a certain period." He explained that the Input-Output Team is a group of more than 10 members, with each member in charge of several industries to compile statistics, and stated that this lecture is a session covering the overall concept of Input-Output tables.
An "Economic Force" that is as natural as gravity but difficult to understand
In the introduction of the lecture, Shin used analogies of "gravity" and "electromagnetic force." Just as the reason we do not fall through to the center of the Earth is due to the electromagnetic force, which is the force of repulsion between electric charges, he explained that the Input-Output table contains the core structure showing how industries are intertwined and move within the economic system. He said, "The statistics of the Input-Output table are quite difficult to understand," and added, "If my goal is to explain at least what gravity is, I will convey even the detailed stories that are a bit difficult to know and unfamiliar, like electromagnetic force."
He also mentioned the difficulty of the content, saying, "If I had sat in this position two years ago and listened to this lecture, I don't think I would have understood much," but added, "Understanding how to interpret and utilize the Input-Output table is like understanding gravity." In particular, he mentioned cases of inquiries via telephone or email from the outside asking, "How will the tariff policies of the Trump administration affect the decrease in our country's exports, and how much will the number of employed persons in each sector decrease as a ripple effect," and emphasized that such calculations are possible using the Input-Output table.
The Input-Output table originated from the analysis method announced by the American economist Wassily Leontief in 1936. Leontief received the Nobel Memorial Prize in Economic Sciences in 1973 for this achievement. In the case of South Korea, after the Ministry of Reconstruction announced a basic level table in 1958, the Bank of Korea first announced a systematized Input-Output table in 1963 and has been continuously compiling it to the present. The '2024 Input-Output Table' introduced in the video has a structure where it is compiled and announced in 2026 based on 2024 data.
From buyer's prices to basic prices, the reference points of statistics
The price standards that constitute the Input-Output table are largely divided into three types. Shin explained a stepwise structure starting from 'buyer's prices,' which are closely related to real life, followed by 'producer's prices,' and then 'basic prices.' This is a very important point because the resulting values change depending on which figure is used as a standard when aggregating statistics.
First, 'buyer's price' refers to the 1,000 won itself if a consumer buys bottled water at a convenience store for 1,000 won. However, if a company purchases it to use in the production process, the value-added tax (VAT) that can be deducted later is excluded from the aggregation. If distribution margins (wholesale and retail margins) and freight charges (delivery fees) are excluded from this, it becomes the 'producer's price.' Finally, by subtracting the 'product tax,' which is a tax imposed on products, from the producer's price and adding 'product subsidies,' the 'basic price' is calculated. Shin explained, "Strictness and intuition are a relationship that is difficult to go together," and "Because it is easy to be wrong if it is too strict, I strove for an understanding based on intuition in this lecture."
Industries and products, the basic units of economic statistics
To accurately understand the Input-Output table, the definitions of 'industry' and 'product' must be clearly established. Citing the international standard SNA, Shin defined an industry as "a group of establishments engaged in the same or similar types of production activities." Here, 'establishment' refers to individual business locations (headquarters, factories, branches, etc.) that constitute a company, and the statistics are the result of investigating and aggregating these individual establishments. A company is used as a larger concept than an establishment.
Furthermore, the term 'Product' used in the table does not simply mean physical objects, but is a concept that encompasses both goods and services. The Input-Output table is largely divided into the Input-Output Table and the Supply-Use Table; the Input-Output Table is characterized by having a square matrix form that shows intermediate input relationships. On the other hand, the Supply-Use Table announced by the Bank of Korea differs in that it takes a rectangular matrix form.
Shin stated that through this lecture, he hopes that students will grasp the basic structure of the Input-Output table and further build a foundation to independently calculate the ripple effects that macro issues, such as tariff policies or the creation of a semiconductor cluster in Jeolla, have on various sectors of the economy.
Source: original video (YouTube)



0Comments
Comments are currently disabled.