
US stock markets hit record highs while South Korea plunges 27%, the secret of the interest rate time lag
While US stock markets continue their upward trend by hitting record highs, the South Korean KOSPI has shown a contrasting trend, falling by approximately 27% over four months since June 22. The divergence is attributed to the time lag between interest rate hikes and their actual impact on the economy, determined by debt maturity.

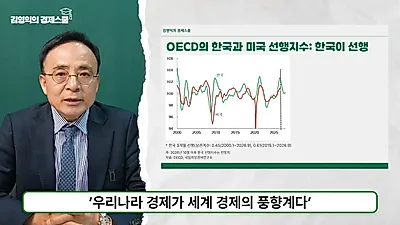
While the US stock market continues its upward trend by breaking record highs, the South Korean KOSPI index is showing a contrasting flow, undergoing a large-scale correction. According to the analysis provided by Park Jong-hoon's Knowledge Remedy, the South Korean KOSPI fell by about 27% over the four months since June 22, showing weakness that differs from other countries. On the other hand, the United States, Taiwan, and Japan maintained a robust trend, with the Nasdaq recording an all-time high on October 6.
KOSPI falls 2.6% despite Samsung Electronics' historic performance
Recent movements in the South Korean stock market showed a mismatch between corporate performance and stock price direction. On October 8, Samsung Electronics announced its third-quarter operating profit of 17 trillion won, a performance evaluated as worthy of opening the era of 100 trillion won for the first time in history. However, on the same day, the KOSPI index actually fell by 2.6%. Securities circles analyzed that supply and demand factors, such as ETF rebalancing or option expiration coinciding with the timing of Samsung Electronics' earnings announcement, led to the stock price decline. Additionally, the fact that the effect of share buybacks by major companies such as Samsung Electronics and SK hynix has ended is mentioned as one of the reasons why the momentum supporting the stock market has weakened.
The 'time lag' between interest rate hikes and economic crisis, maturity is the key
The fundamental reason why the direction of stock prices in the United States and South Korea diverges can be found in the relationship between interest rates and economic structure. When interest rates rise, the 'bill' that puts a burden on the economy arrives, but the speed varies depending on the economic structure. The key is the 'maturity' of bonds or loans. Companies that issued long-term bonds (5 years, 10 years, etc.) during low-interest periods can enjoy the benefits of low interest rates until the maturity arrives. Because US companies have a relatively high proportion of corporate bonds with long maturities, there is a time lag until the actual high-interest burden occurs even if the base interest rate rises. Even in the past, during 1994 or the dot-com bubble in 1999, there was a time lag of several months before actual cracks appeared in the market after the base interest rate hike.
Resembling the 2007 financial crisis... what is the situation in 2026?
The current market situation has points similar to the flow just before the 2007 global financial crisis. In 2007, even though the US 10-year Treasury bond yield began to rise, the S&P 500 index recorded an all-time high in October of that year, and optimism that "this time is different" was dominant. However, it later coincided with the timing of the conversion to floating interest rates for subprime mortgage loans, causing the housing market to collapse and eventually leading to the global financial crisis. As of 2026, the high-interest rate trend continues, with the US 10-year Treasury bond yield recording 5.36%, the highest since 2002, so the duration of interest rate maintenance and the timing of maturity arrivals are expected to be the turning points for the economy.
Source: original video (YouTube)


0Comments
Comments are currently disabled.